UKCP18 Days TAS Above Indicator example via Hazard#
This notebook should be able to run independantly as long as you’ve installed the repositories requirements.
For example, I used the pdm approach:
pip install pdm
pdm config venv.with_pip True
pdm install
You will also need CEDA FTP credentials. This notebook expects the following environment variables:
CEDA_FTP_URL="ftp.ceda.ac.uk"
CEDA_FTP_USERNAME=<your-general-ceda-username>
CEDA_FTP_PASSWORD=<your-ceda-ftp-password> # This is separate to your normal CEDA login password - See: https://help.ceda.ac.uk/article/280-ftp
Setup imports#
[1]:
import logging
import sys
import os
from pathlib import Path

from dask.distributed import Client, LocalCluster
import zarr

from hazard.models.days_tas_above import DaysTasAboveIndicator
from hazard.models.degree_days import DegreeDays
from hazard.sources.ukcp18 import Ukcp18
from hazard.sources.osc_zarr import OscZarr
from dotenv import load_dotenv

load_dotenv("../credentials.env")
[1]:
True
Setup Hazard#
[2]:
logging.basicConfig(
    level=logging.INFO,
    format="[%(asctime)s] {%(filename)s:%(lineno)d} %(levelname)s - %(message)s",
    handlers=[
        logging.FileHandler(filename="batch.log"),
        logging.StreamHandler(sys.stdout),
    ],
)

cluster = LocalCluster(processes=False, n_workers=1, threads_per_worker=1)
client = Client(cluster)

gcm = "ukcp18"
scenario = "rcp85"
year = 2030

# source = Ukcp18(resolution="60km", domain="global")
# source = Ukcp18(resolution="60km", domain="uk")
# source = Ukcp18(resolution="12km", domain="eur")
# source = Ukcp18(resolution="12km", domain="uk")
# source = Ukcp18(resolution="5km", domain="uk")
source = Ukcp18(resolution="2.2km", domain="uk")

# Just store stuff locally as it's easier
test_output_dir = Path("./src/test/test_output")
store = zarr.DirectoryStore(test_output_dir / "hazard" / "hazard.zarr")
target = OscZarr(store=store, write_xarray_compatible_zarr=True)

model = DaysTasAboveIndicator(
    threshold_temps_c=[15],
    window_years=1,
    gcms=[gcm],
    scenarios=[scenario],
    central_years=[year],
)

# model = DegreeDays(
#     threshold=15,
#     window_years=1,
#     gcms=[gcm],
#     scenarios=[scenario],
#     central_years=[year],
#     central_year_historical=year
# )
[2024-09-10 14:12:39,774] {days_tas_above.py:63} INFO - Starting calculation for year 2030
[2024-09-10 14:12:41,029] {io.py:140} WARNING - CPLE_AppDefined in dimension #1 (time) is not a Time dimension.
[2024-09-10 14:12:41,030] {io.py:140} WARNING - CPLE_AppDefined in dimension #0 (ensemble_member) is not a Time dimension.
[2024-09-10 14:12:41,035] {io.py:140} WARNING - CPLE_AppDefined in Unhandled X/Y axis unit degrees. SRS will ignore axis unit and be likely wrong.
[2024-09-10 14:12:41,035] {io.py:140} WARNING - CPLE_AppDefined in Latitude grid not spaced evenly.  Setting projection for grid spacing is within 0.1 degrees threshold.
[2024-09-10 14:12:45,546] {days_tas_above.py:69} INFO - Calculation complete for year 2030
Run model#
[3]:
model.run_all(source, target, client=client)
[2024-09-10 14:12:38,020] {multi_year_average.py:124} INFO - Calculating average indicator for batch item gcm=ukcp18, scenario=rcp85, central_year=2030, years=[2030]
[2024-09-10 14:12:45,580] {multi_year_average.py:91} INFO - Writing array to chronic_heat/osc/v2/days_tas_above_15c_ukcp18_rcp85_2030
[2024-09-10 14:12:45,616] {map_utilities.py:46} INFO - Generating map projection for file chronic_heat/osc/v2/days_tas_above_15c_ukcp18_rcp85_2030; reading file
[2024-09-10 14:12:45,635] {map_utilities.py:48} INFO - Reprojecting to EPSG:3857
[2024-09-10 14:12:45,676] {map_utilities.py:54} INFO - Writing map file chronic_heat/osc/v2/days_tas_above_15c_ukcp18_rcp85_2030_map
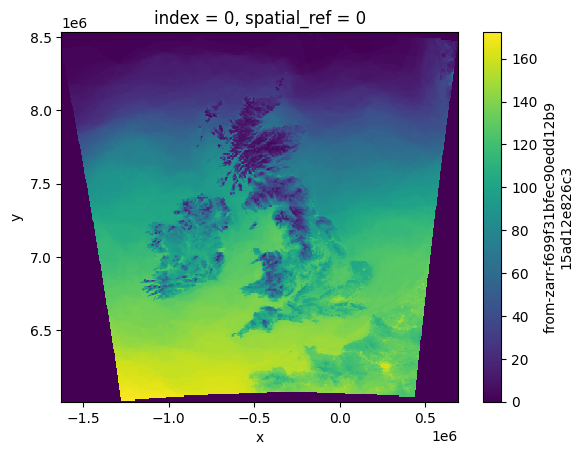
Visualise indicator#
[4]:
indicator = target.read("chronic_heat/osc/v2/days_tas_above_15c_ukcp18_rcp85_2030_map")
indicator.plot()
[4]:
<matplotlib.collections.QuadMesh at 0x309d0aeb0>